
Flow Diagrams
Compressed system maps showing how incentives, signals, and structures move through human systems. Grounded in Convivial Systems Theory. Curated as they emerged.


Systems Flow Diagrams
Systems thinking often shows up as flow — decision points, incentives, signal paths, and where things stall or accelerate.
Sometimes the most honest way to capture a systems-related thought is not an essay, but a compressed diagram: the few steps that actually matter, laid out in sequence.
This page is a curated shelf of those diagrams, placed as they emerged.
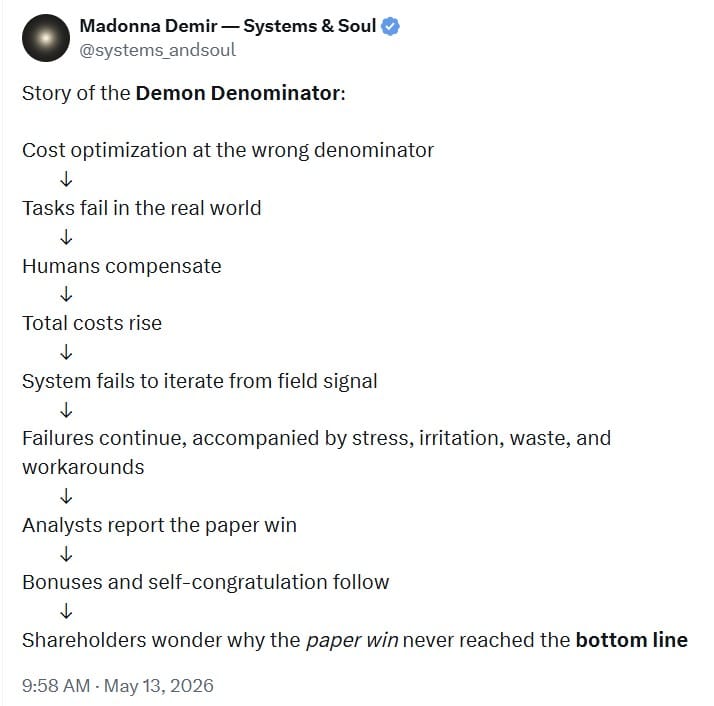
Demon Denominator Flow
Date: May 13, 2026
Flow
Cost optimization at the wrong denominator →
tasks fail in the real world →
humans compensate →
total costs rise →
the system fails to iterate from field signal →
failures continue, accompanied by stress, irritation, waste, and workarounds →
analysts report the paper win →
bonuses and self-congratulation follow →
the paper win never reaches the bottom line
Compression
A Demon Denominator appears when a system optimizes against a unit smaller than the real task.
The metric improves while the lived use degrades. Cups get thinner, so customers take two. Bags get weaker, so shoppers double-bag. Ketchup packets get smaller, so diners open nine. Fuel tanks get smaller, so drivers stop more often. The spreadsheet shows savings because the denominator is too small to contain the actual task.
The Demon Denominator does not eliminate cost. It relocates cost outside the measurement frame. Human beings then compensate through workarounds, extra handling, wasted material, irritation, risk, and lost trust.
The test is simple: is the system measuring the component, or the completed human task?
Provenance
Developed from everyday product failures involving thin coffee cups, weak grocery bags, undersized ketchup packets, and fuel-tank optimization. Formalized in the essay The Demon Denominator as a Convivial Systems Theory diagnostic for false efficiency, denominator drift, and cost relocation. Summarized in an X post.
Related Systems Diagnostics
Completed Task Denominator
The correct denominator should attach to the full human task, not the smallest measurable component.
Field Signal Test
Workarounds are evidence. When users double-cup, double-bag, open multiple packets, avoid the app, or create shadow processes, the system is reporting a design failure.
False Efficiency Check
Savings are not real if they increase waste, handling, risk, irritation, exclusion, or downstream correction.
Buffer Looks Like Waste
Bad denominators often make resilience, slack, reserve, and adequate material look inefficient because the metric has been drawn too narrowly.
Cost Relocation Pattern
The cost has not disappeared if it has moved to the customer, worker, environment, community, or future repair path.
Paper Win / Real Loss Split
The metric can improve while the system becomes more fragile, more wasteful, and less trusted.
Related Work
This flow sits near the work on Demon Denominator, Campus Monetization, Theater of Fragility, hidden UBI, local-content requirements, public-private extraction, and AI and software denominator drift. It also connects to procurement, product design, civic infrastructure, and any system where local savings create downstream burden.
Notes
This flow is meant to distinguish real efficiency from counterfeit efficiency.
The key question is not whether a measured unit improved. The key question is whether the real task improved. A cheaper cup is not a better cup if customers need two. A cheaper bag is not a better bag if groceries fall through it. A better miles-per-gallon number is not a better driving experience if the fuel range becomes worse.
When the denominator is wrong, the system can celebrate savings while users quietly repair the design. The workarounds are the signal. The burden is the bill.
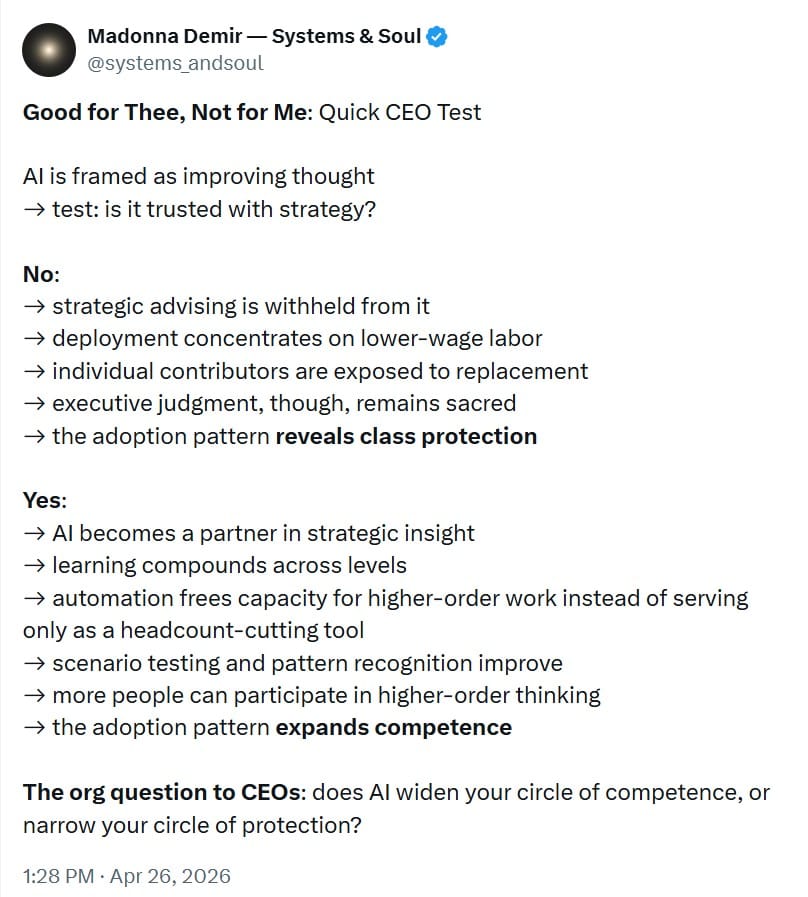
Good for Thee, Not for Me: Quick CEO Test
Date: April 26, 2026
Flow
AI is framed as improving thought →
test: is it trusted with strategy?
No:
Strategic judgment is withheld from it →
deployment concentrates on lower-wage labor →
individual contributors are exposed to replacement →
executive judgment, though, remains sacred →
the adoption pattern reveals class protection
Yes:
AI becomes a partner in strategic insight →
learning compounds across levels →
automation frees capacity for higher-order work instead of serving only as a headcount-cutting tool →
scenario testing and pattern recognition improve →
more people can participate in higher-order thinking →
the adoption pattern expands competence
Compression
AI adoption reveals doctrine. If a firm claims AI improves thinking but reserves strategic judgment for executives while applying automation downward to lower-wage and individual-contributor work, the system is not primarily expanding intelligence. It is protecting class position.
A more competent adoption pattern would use AI to widen strategic participation, compound learning, reduce mundane work, and move freed capacity into higher-order contribution.
The test is simple: does AI widen the circle of competence, or narrow the circle of protection?
Provenance
Originally developed from an X post after a failed compression attempt clarified the underlying diagnostic. Formalized here as a flow diagram for reading AI adoption patterns by where augmentation and replacement are allowed to land.
Related Systems Diagnostics
- Deployment Reveals Belief
Public claims matter less than where the tool is actually aimed. - Additive Above / Subtractive Below
AI becomes class-protective when it augments protected decision-makers while exposing lower-status workers to replacement. - Sacred Judgment Test
If executive judgment is treated as uniquely human while other workers’ judgment is treated as automatable, the adoption pattern is revealing hierarchy, not merely efficiency. - Circle of Competence Test
Does the system use AI to broaden who can think strategically, or to concentrate judgment while cutting labor below? - Headcount-Cutting Default Check
Does automation free capacity for better work, or is all freed capacity immediately harvested as labor reduction?
Related Work
This flow sits near the hidden-UBI and automation flows, especially the work on automation being hidden in payroll and employment stabilization mechanisms.
Notes
This flow is meant to distinguish AI adoption from AI ideology. The key question is not whether leadership praises AI, pilots AI, or buys AI tools. The key question is where the organization allows AI to act as augmentation, and where it uses AI as exposure.
When AI is additive near power and subtractive near labor, the system is not democratizing intelligence. It is protecting the layer already closest to authority.
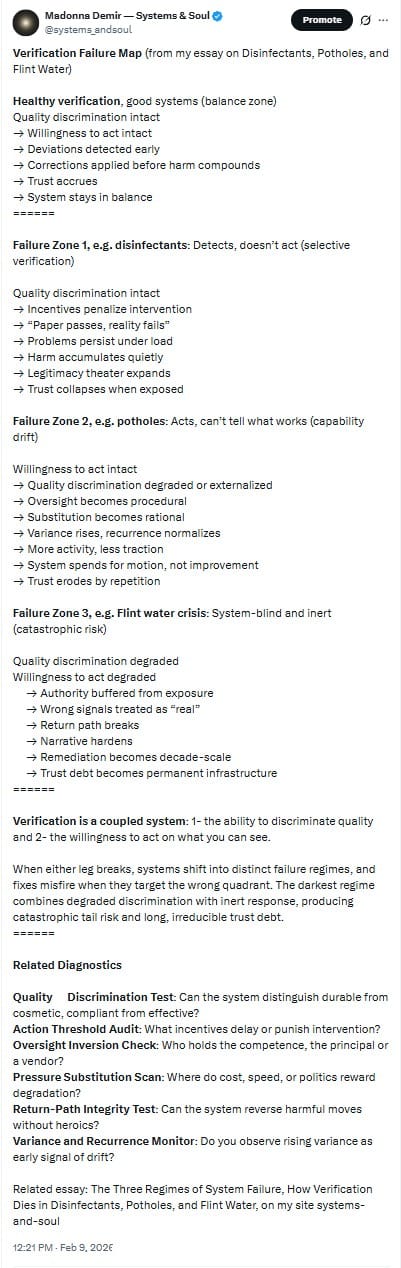
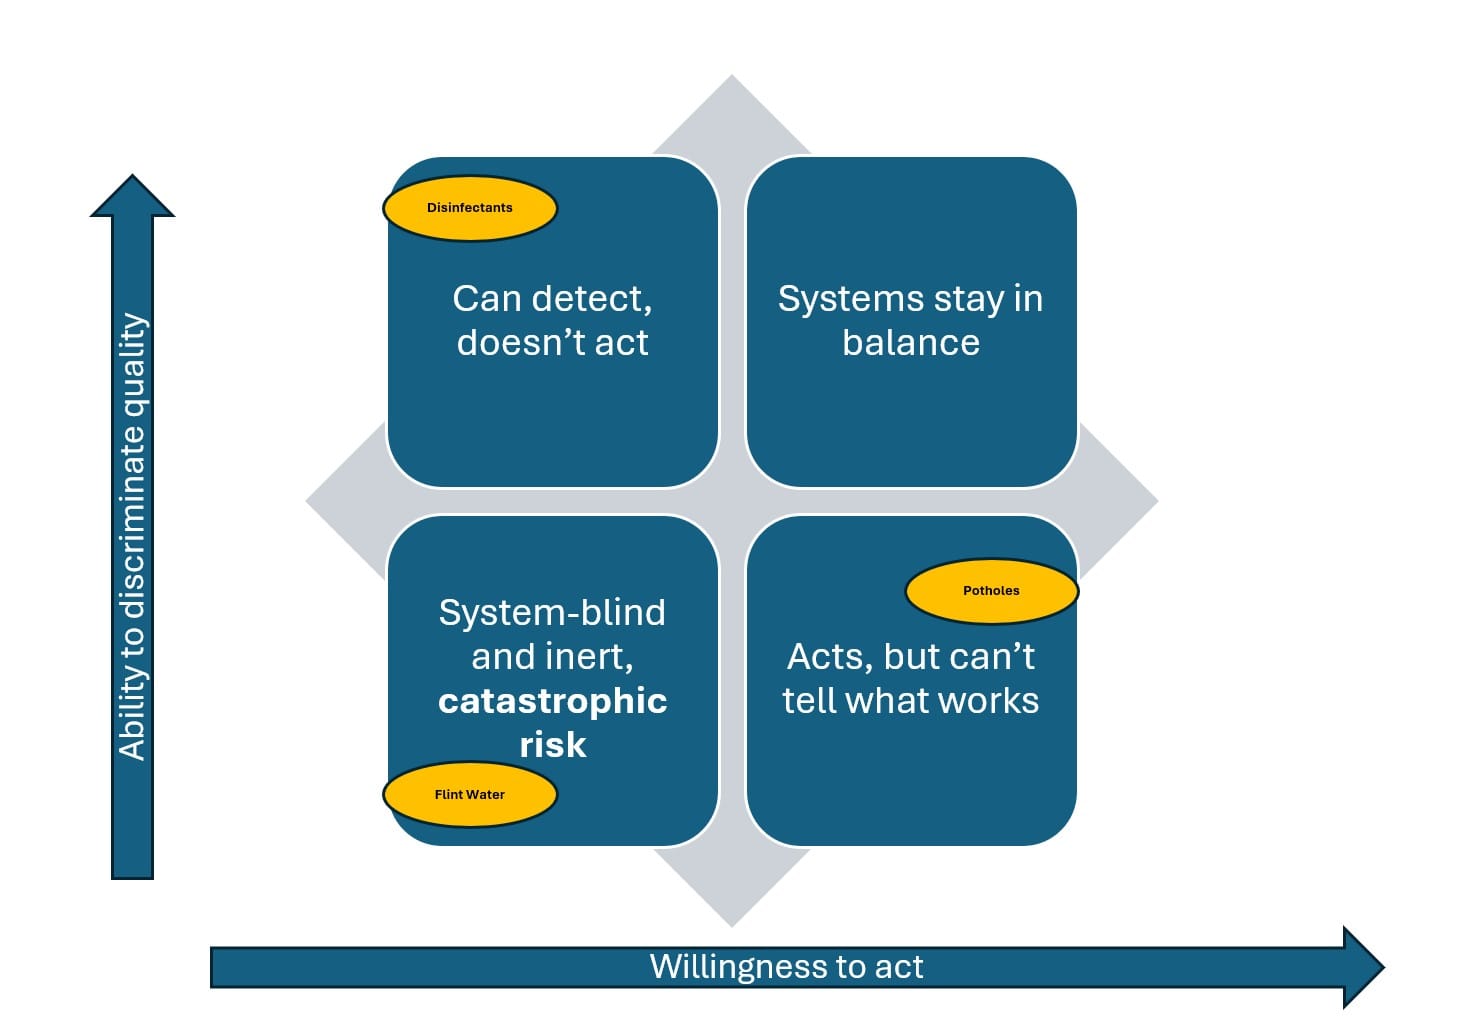
Verification Failure Map
Date: February 9, 2026
Flow
Healthy verification, good systems (balance zone)
Quality discrimination intact →
Willingness to act intact →
Deviations detected early →
Corrections applied before harm compounds →
Trust accrues →
System stays in balance
Failure Zone 1, e.g. disinfectants: Detects, doesn’t act (selective verification)
Quality discrimination intact →
Incentives penalize intervention →
Paper passes, reality fails →
Problems persist under load →
Harm accumulates quietly →
Legitimacy theater expands →
Trust collapses when exposed
Failure Zone 2, e.g. potholes: Acts, can’t tell what works (capability drift)
Willingness to act intact →
Quality discrimination degraded or externalized →
Oversight becomes procedural →
Substitution becomes rational →
Variance rises, recurrence normalizes →
More activity, less traction →
System spends for motion, not improvement →
Trust erodes by repetition
Failure Zone 3, e.g. Flint water: System-blind and inert (catastrophic risk)
Quality discrimination degraded →
Willingness to act degraded →
Authority buffered from exposure →
Wrong signals treated as “real” →
Return path breaks →
Narrative hardens →
Remediation becomes decade-scale →
Trust debt becomes permanent infrastructure
Compression
Verification is a coupled system: the ability to discriminate quality, and the willingness to act on what you can see.
When either leg breaks, systems shift into distinct failure regimes. Fixes misfire when they target the wrong quadrant. The darkest regime combines degraded discrimination with inert response, producing catastrophic tail risk and long, irreducible trust debt.
Provenance
Originally developed as a quadrant map and published on X as a flow diagram alongside the essay The Three Regimes of System Failure. Formalized here as a reference artifact for diagnosing why “reasonable” interventions fail.
Related Essay
The Three Regimes of System Failure, How Verification Dies in Disinfectants, Potholes, and Flint Water — Systems & Soul
Related Systems-in-Action
Capability Drift Hidden in Infrastructure (potholes as a drift regime)
When AI Safety Becomes a Supply Chain (adjacent pattern: verification outsourced into vendor stacks)
Related Systems Diagnostics
Quality Discrimination Test
Action Threshold Audit
Oversight Inversion Check
Substitution Pressure Scan
Return-Path Integrity Test
Variance and Recurrence Monitor
Notes
This flow is meant to be used as a regime detector. Before debating intent or ideology, locate the failure zone. Then match the intervention to the regime: incentives and enforcement for selective verification, competence and sensing loops for capability drift, and return-path integrity for catastrophic-risk overrides.
Automation Isn’t Coming, The Evidence Is Hidden in Payroll
Date: January 24, 2026
Flow
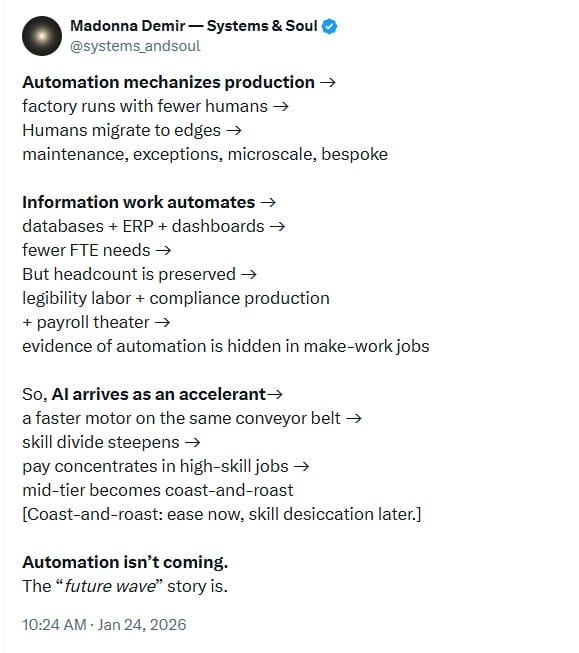
Automation mechanizes production →
Factory runs with fewer humans →
Humans migrate to edges →
Maintenance, exceptions, microscale, bespoke →
Information work automates →
Databases + ERP + dashboards →
Fewer FTE needs →
But headcount is preserved →
Legibility labor + compliance production + payroll theater →
Evidence of automation is hidden in make-work jobs →
So, AI arrives as an accelerant →
A faster motor on the same conveyor belt →
Skill divide deepens →
Pay concentrates in high-skill jobs →
Mid-tier becomes coast-and-roast →
Coast-and-roast: ease now, skill desiccation later.
Automation isn’t coming.
The “future wave” story is.
Compression
Automation already reduced the labor required for both production and information work. Institutions preserved equilibrium by shifting humans into edge cases and legibility labor, then narrating that equilibrium as “jobs.”
AI is the accelerant, not the first wave.
Provenance
Originally posted as a flow diagram on X.
Formalized here as a companion artifact to the essay Why Automation Isn’t Coming.
Related Essay
Automation Isn't Coming. It Already Happened and We Hid the Evidence — Systems & Soul
Related Systems-in-Action
UBI Dressed Like Work — Future of Work Series (adjacent mechanism: payroll-routed equilibrium)
Related Systems Diagnostics
Legibility Capture
Incentive Drift Analysis
Payroll Theater Detection
Notes
This flow distinguishes between core automation (production and information work) and the stabilizing layers that grow around it. When output decouples from headcount, institutions tend to preserve employment through legibility labor, compliance work, and coordination theater. AI amplifies this trend by accelerating systems that already made mid-tier labor cheaper and more redundant.
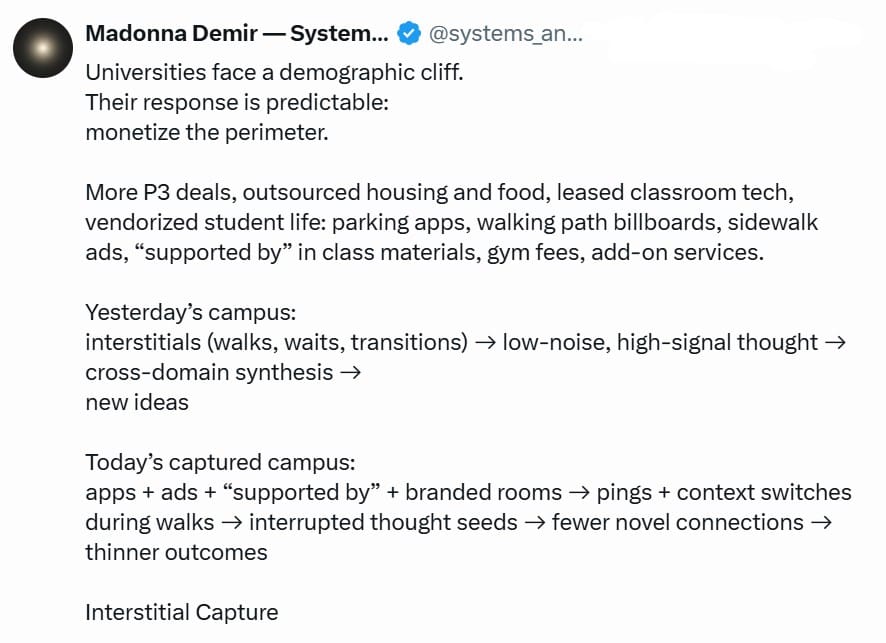
Interstitial Capture
Date
January 16, 2026
Flow
Demographic cliff →
Revenue pressure rises →
Monetize the perimeter →
P3 deals + outsourced services + app-gated access →
Ads and sponsorships saturate the “in-between” →
Interstitials fill with pings and context switches →
Low-noise, high-signal thought collapses →
Cross-domain synthesis declines →
Fewer novel connections →
Thinner outcomes →
Compression
When universities monetize the interstitial space between classes, they don’t just add distraction. They sell the cognitive corridor where synthesis forms, converting idea-generation into interrupted fragments.
Provenance
Originally developed as a standalone flow diagram on X.
Formalized as Interstitial Capture Doctrine.
Related Systems Diagnostics
• Distortion Detection Test
Noise overtakes signal when every transition becomes an ad surface or app prompt.
• Signal-to-Noise Diagnostic
Synthesis requires quiet corridors. Capture converts corridors into noise fields.
• Cognitive Load Test
App-gated access and monetized friction add micro-demands until cognition loses working capacity for integration.
• Drift Detection Test
Interstitial capture begins as “small” additions: one app, one sponsorship, one billboard. Accumulation becomes structural.
• Incentive Stability Check
Incentives reward perimeter monetization (contracts, fees, sponsorship) while the cost is paid in degraded learning and idea yield.
• Minimum Promise Boundary Check
Silent promise violated: a university should protect attention and learning conditions, not auction them.
Notes
Perimeter monetization looks like “services” and “support,” but functions as capture of transitional space. The loss is not easily measured in quarterly terms because it shows up as missed synthesis: fewer cross-domain insights, weaker original work, and a thinner intellectual environment. The institution gains short-term revenue and loses long-term idea production.
Attention Theft
Date
January 8, 2026
Flow
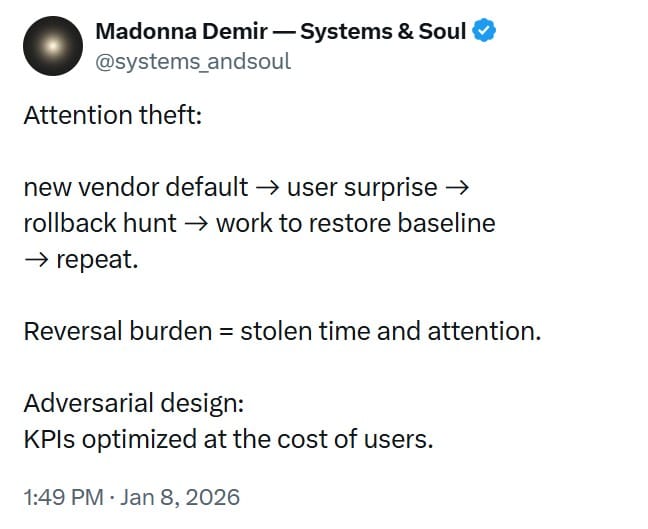
New vendor default →
User surprise →
Rollback hunt →
Work to restore baseline →
Repeat →
Compression
Defaults shift the environment. Reversal shifts the labor. The user pays the cost of restoring baseline in time and attention.
Provenance
Originally developed as a standalone flow diagram on X.
Formalized as Attention Theft Doctrine.
Related Systems Diagnostics
- Incentive Stability Check
The vendor incentive is stable: ship defaults that drive KPIs. User incentive is stable: preserve baseline. Collision is predictable. - Cognitive Load Test
Rollback hunts push cognitive load beyond reasonable interpretability, especially when toggles are fragmented across products. - Drift Detection Test
“Small drift” is the default flipping itself, the UI moving, the new surface appearing. Catching it early prevents a larger attention bleed. - Minimum Promise Boundary Check
Silent promise violated: “my inbox and calendar remain mine unless I explicitly opt in.” - Fairness Floor Test
Asymmetry becomes corrosive when the vendor externalizes reversal labor onto the user. - Elegant Restraint Test
The upstream question the vendor avoided: should this be done at all, by default.
Notes
This pattern is not defined by the new feature. It is defined by the lack of a reversal burden, requiring detection, attribution, rollback search, and baseline restoration. The recurrence mechanism is “new surface, same default logic.” Users experience it as theft because the cost is paid in fragments of their attention, and the fragments accumulate.
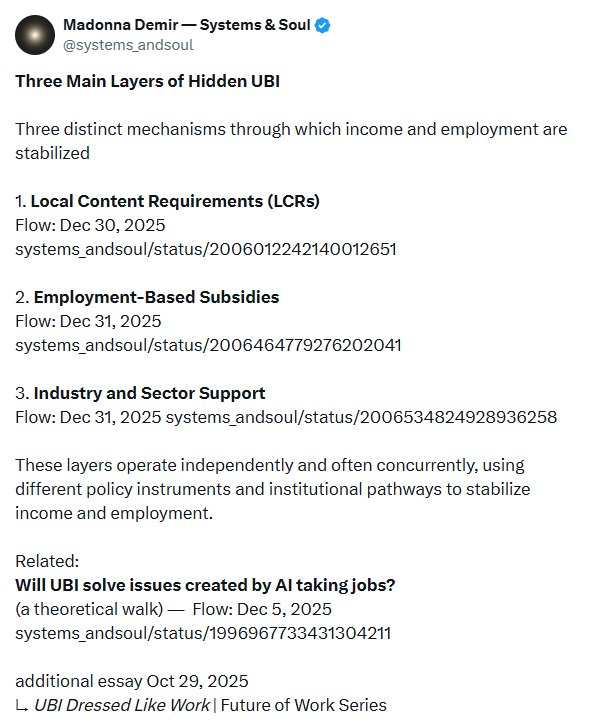
Three Main Layers of Hidden UBI
Date
December 31, 2025
This work identifies three distinct mechanisms through which income and employment are stabilized without explicit universal cash transfers.
1. Local Content Requirements (LCRs)
Flow posted on X: December 30, 2025
2. Employment-Based Subsidies
Flow posted on X: December 31, 2025
3. Industry and Sector Support
Flow posted on X: December 31, 2025
These layers operate independently and often concurrently. Each stabilizes income and employment through different policy instruments, incentive structures, and institutional pathways.
Provenance
Originally developed as an index on X.
Related Work
Will UBI solve issues created by AI taking jobs?
A theoretical walk
Posted on X December 5, 2025
Notes
This index names mechanisms without evaluating them. Each layer is documented separately through flow diagrams that trace causality, enabling conditions, and downstream effects.
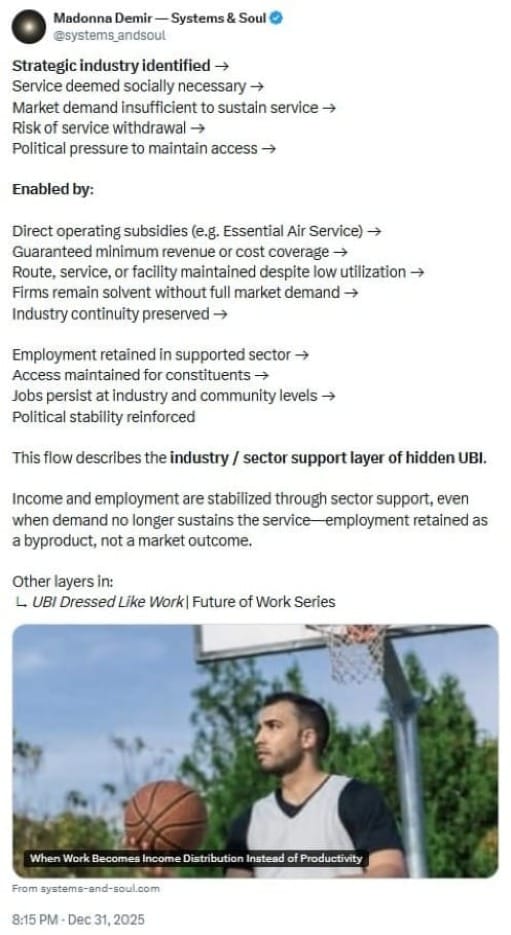
Industry Support Programs Preserve Employment and Access
Date
December 31, 2025
Flow
Strategic industry identified →
Service deemed socially necessary →
Market demand insufficient to sustain service →
Risk of service withdrawal →
Political pressure to maintain access →
Mechanisms:
Direct operating subsidies (e.g. Essential Air Service) →
Guaranteed minimum revenue or cost coverage →
Route, service, or facility maintained despite low utilization →
Firms remain solvent without full market demand →
Industry continuity preserved →
Employment retained in supported sector →
Access maintained for constituents →
Jobs persist at industry and community levels →
Political stability reinforced
This flow describes the industry / sector support layer of hidden UBI.
Compression
Sector support stabilizes income and employment even when demand no longer sustains the service. Employment persists as a byproduct of continuity, not as a market outcome.
Provenance
Originally developed as a standalone flow diagram on X.
Formalized as part of the Systems & Soul analysis of sector-level stabilization mechanisms.
Related Systems-in-Action
UBI Dressed Like Work — Future of Work Series
Related Systems Diagnostics
Incentive Drift Analysis
Service Continuity Test
Notes
This flow describes an industry-level stabilization mechanism in which public support flows to firms, routes, or facilities rather than directly to individuals.
Employment and income persist as downstream effects of service continuity, not as market-driven outcomes. Inefficiency is tolerated in order to preserve geographic access, sector presence, and political stability.
The structure generalizes across transportation, healthcare, agriculture, energy, defense, and other sectors where access and continuity are prioritized over utilization or profitability.
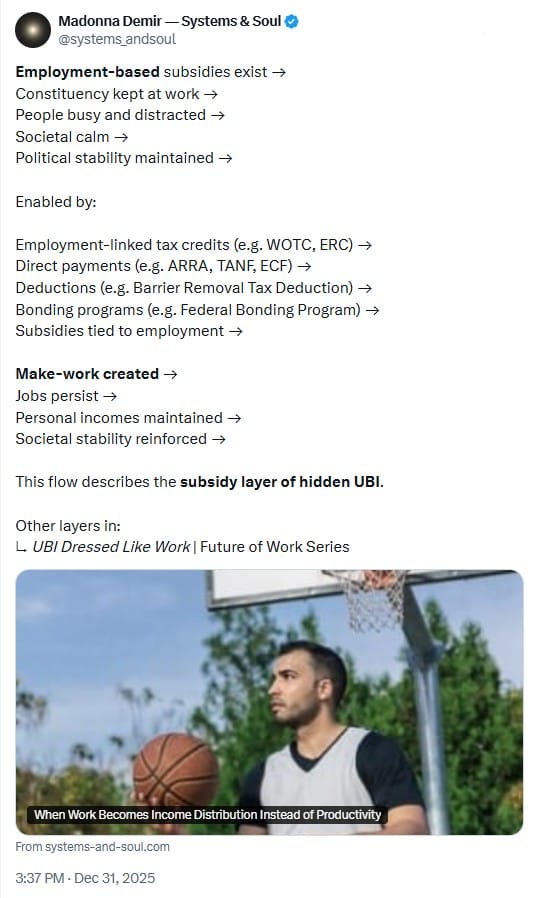
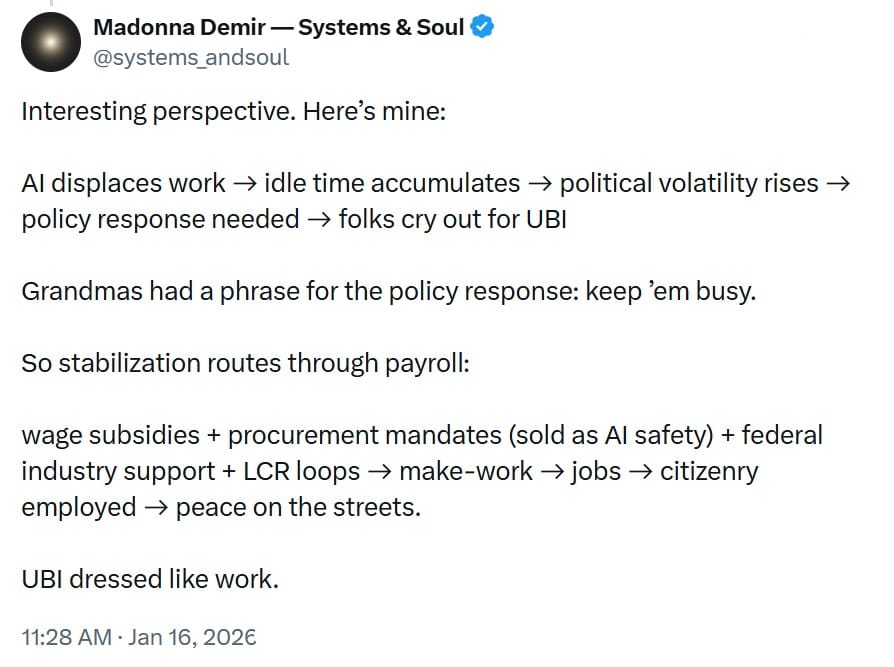
Employment-Based Subsidies Create Make-Work Stability
Date
December 31, 2025
Flow
Employment-based subsidies exist →
Constituency kept at work →
People busy and distracted →
Societal calm →
Political stability maintained →
Enabled by:
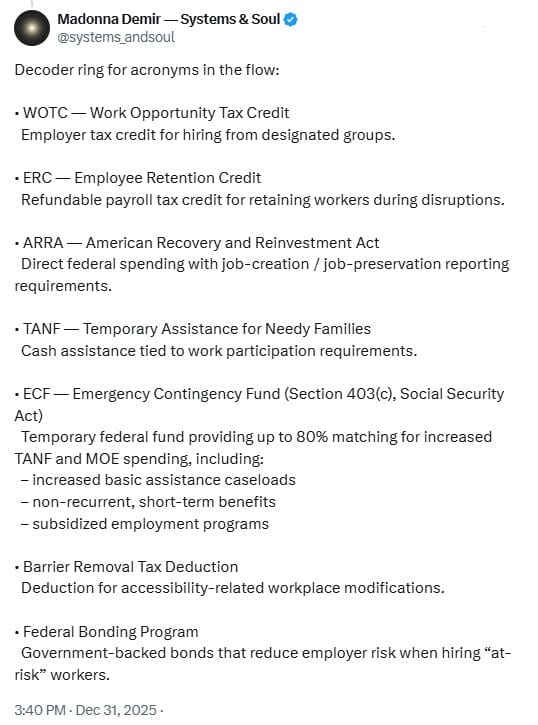
Employment-linked tax credits (e.g. WOTC, ERC) →
Direct payments (e.g. ARRA, TANF, ECS) →
Deductions (e.g. Barrier Removal Tax Deduction) →
Bonding programs (e.g. Federal Bonding Program) →
Subsidies tied to employment →
Make-work created →
Jobs persist →
Personal incomes maintained →
Societal stability reinforced →
This flow describes the subsidy layer of hidden UBI.
Compression
Employment can be stabilized through subsidies tied to work, even when the work itself is not economically necessary.
Provenance
Originally developed as a standalone flow diagram on X.
Formalized as part of the Systems & Soul analysis of employment-based stabilization mechanisms.
Related Systems-in-Action
UBI Dressed Like Work — Future of Work Series
Related Systems Diagnostics
Incentive Drift Analysis
Make-Work Detection Test
Notes
This flow describes the subsidy layer of hidden UBI: a mechanism in which income support is delivered indirectly through employment-linked programs rather than explicit cash transfers.
By tying financial support to job participation, these programs preserve employment statistics, absorb attention, and produce societal calm—while masking income redistribution as labor market health.
The pattern generalizes across infrastructure spending, workforce programs, accessibility compliance, and public–private employment incentives where stability is prioritized over productive necessity.
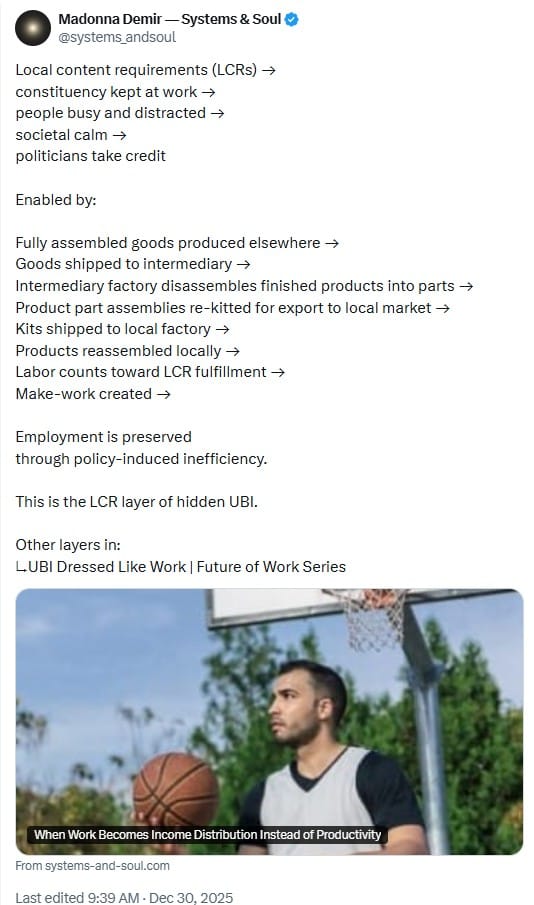
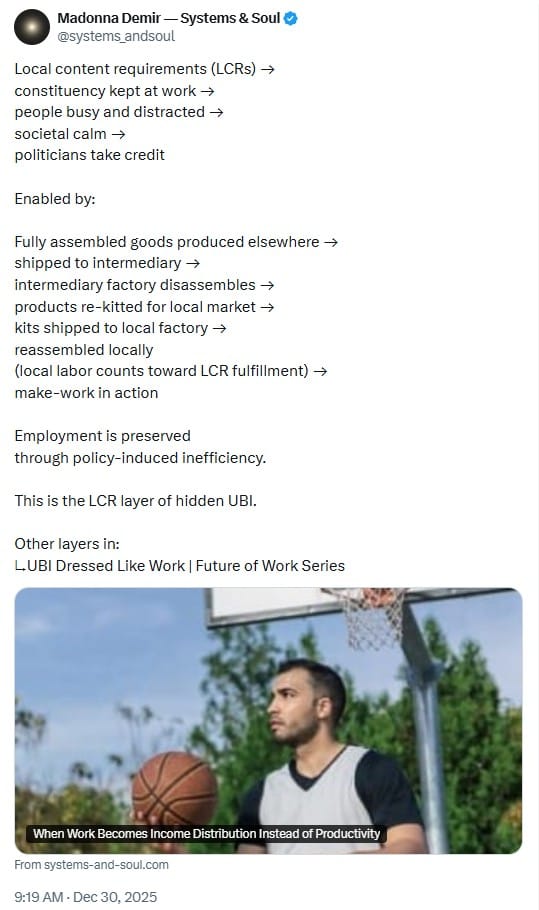
Local Content Requirements Create Make-Work Stability
Date
December 30, 2025
Flow
Local content requirements (LCRs) exist →
Domestic employment targets become a policy constraint →
Constituency kept at work →
People busy and distracted →
Societal calm increases →
Political pressure decreases →
Politicians take credit for employment stability →
Enabled by:
Fully assembled goods produced elsewhere →
Goods shipped to intermediary →
Intermediary factory disassembles finished products into parts →
Product part assemblies re-kitted for export to local market →
Kits shipped to local factory →
Products reassembled locally →
Labor counts toward LCR fulfillment →
Make-work created →
Employment preserved →
Through policy-induced inefficiency.
This is the LCR layer of hidden UBI.
Compression
With LCRs, employment is preserved not by necessity, but by policy-induced inefficiency.
Provenance
Originally developed as a standalone flow diagram on X (shown here in both original unedited and edited versions).
Formalized from Systems & Soul analysis of localization policy and make-work labor dynamics.
Related Systems-in-Action
UBI Dressed Like Work — Future of Work Series
SIA Am I Stuck in a Bullshit Job?
SIA The Control Illusion: How Export Controls Create Shadow Chains and Destroy Containment
Related Systems Diagnostics
Incentive Drift Analysis
Traceability and Containment Test
Notes
This flow describes the LCR layer of hidden UBI: a stabilization mechanism in which employment is maintained through mandated local labor participation rather than through endogenous demand for productive work.
The structure shows how localization rules create constituencies at work, absorb attention, and produce societal calm—while shifting production into inefficient disassembly and reassembly loops that satisfy policy constraints without increasing real output.
The pattern generalizes across manufacturing, defense procurement, energy infrastructure, and other sectors subject to localization mandates where political stability is prioritized over system efficiency.
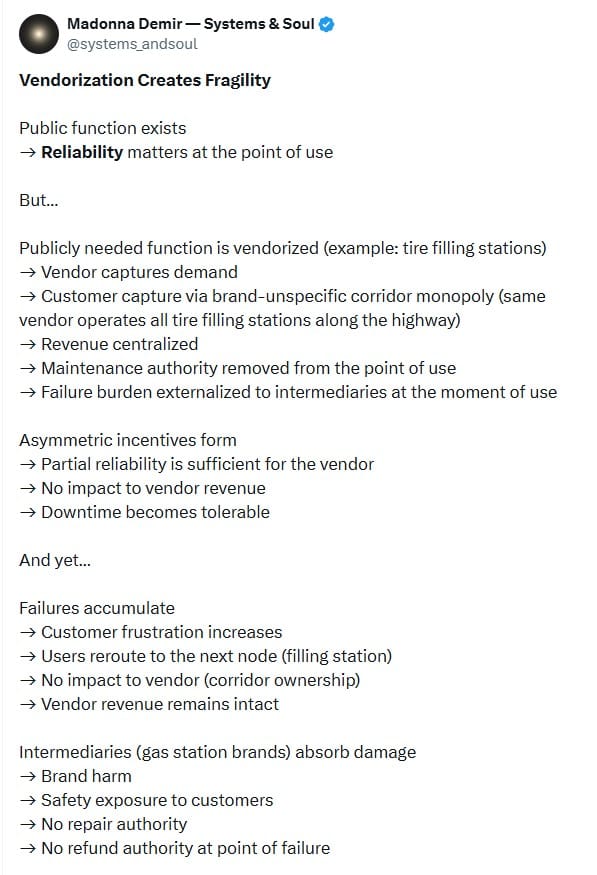
Vendorization Creates Fragility
Date
December 28, 2025
Flow
Public function exists →
Reliability matters at the point of use →
But…
Publicly needed function is vendorized →
Vendor captures demand →
Customer capture via brand-unspecific corridor monopoly →
Revenue centralized →
Maintenance authority removed from the point of use →
Failure burden externalized to intermediaries at the moment of use →
Asymmetric incentives form →
Partial reliability is sufficient for the vendor →
No impact to vendor revenue →
Downtime becomes tolerable →
Failures accumulate →
Customer frustration increases →
Users reroute to the next node →
No impact to vendor (corridor ownership) →
Vendor revenue remains intact →
Intermediaries absorb damage →
Brand harm →
Safety exposure to customers →
No repair authority →
No refund authority at point of failure →
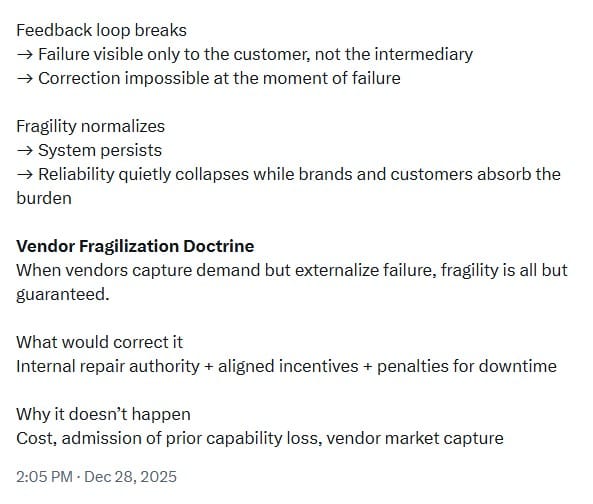
Feedback loop breaks →
Failure visible only to the customer, not the intermediary →
Correction impossible at the moment of failure →
Fragility normalizes →
System persists →
Reliability quietly collapses while brands and customers absorb the burden.
Compression
When vendors capture demand but externalize failure, fragility is all but guaranteed.
Provenance
Originally developed as a standalone flow diagram on X.
Formalized from SIA Systems in Action — When Vendorization Creates Fragility.
Related Systems Diagnostics
- Principal–Agent Drift Analysis
- Drift Detection Test
Notes
This flow describes vendor fragilization: a failure pattern in which reliability degrades because the party controlling maintenance and uptime does not bear the consequences of failure at the point of use.
The structure generalizes across domains including infrastructure, healthcare equipment, enterprise software, education platforms, and other vendorized systems where demand is captive and correction authority is displaced.
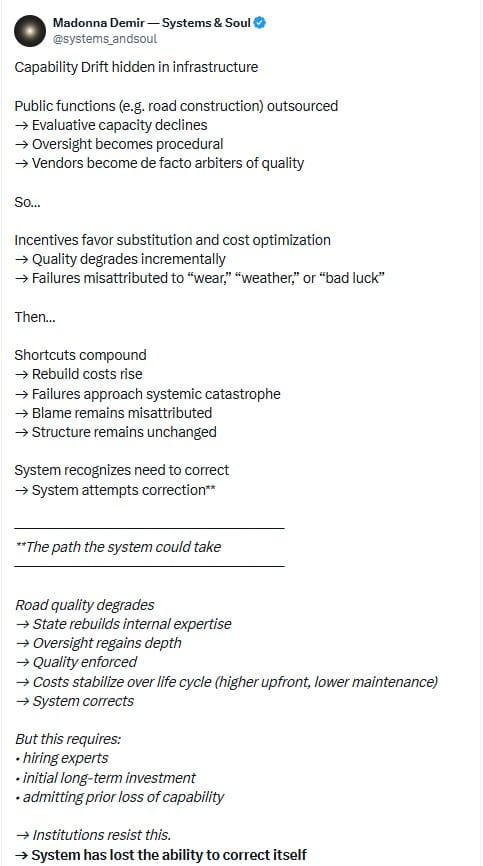
Capability Drift Hidden in Infrastructure
Date
December 27, 2025
Flow
Public functions outsourced →
Evaluative capacity declines →
Oversight becomes procedural →
Vendors become de facto arbiters of quality →
Incentives favor substitution and cost optimization →
Quality degrades incrementally →
Failures misattributed to “wear,” “weather,” or “bad luck” →
Shortcuts compound →
Rebuild costs rise →
System recognizes need to correct →
Pause.
Correction attempted.
Capability required for correction is no longer present →
Institutions resist rebuilding internal expertise →
System loses the ability to correct itself →
Degradation normalizes.
Compression
Systems fail quietly when they retain responsibility but lose the ability to evaluate quality.
Drift replaces collapse.
Provenance
Originally developed as a flow diagram on X.
Formalized from the essay Capability Drift in Public Infrastructure.
Related Systems Diagnostics
- Principal–Agent Drift Analysis | Drift Detection Test
Notes
This flow applies across domains where expertise migrates out of the system while accountability remains nominal. Infrastructure is one visible instance of a broader structural failure pattern.
Traceability Necessary for Containment
Date
December 23, 2025
Flow
Clear chain → error nodes identified → containment
Shadow chain → error nodes hidden → system failure
Traceability = safety (in any system)
Compression
Systems fail if error nodes lose traceability.
Provenance
Originally posted on X

Related SIA
Brittle Power Breaks Interpretability
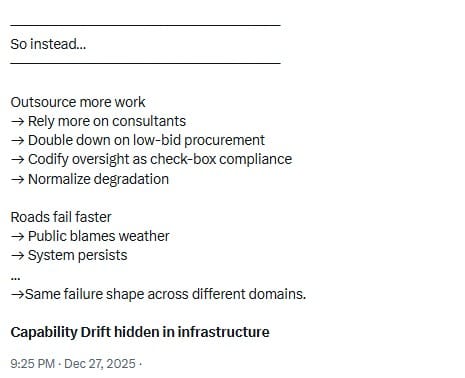
Date
December 18, 2025
Flow
Loss of interpretability →
Pressure replaces structure →
Pause.
Reflect.
Brittle system revealed →
Brittle power breaks interpretability first →
Reflection interrupts the plan.
Compression
When pressure replaces clarity, structure has already failed.
Provenance
Originally posted on X
Related Systems Diagnostics
Cognitive Load Test
Frame Dynamics Diagnostic
Traceability Collapses Containment
Date
December 11, 2025 and December 14, 2025
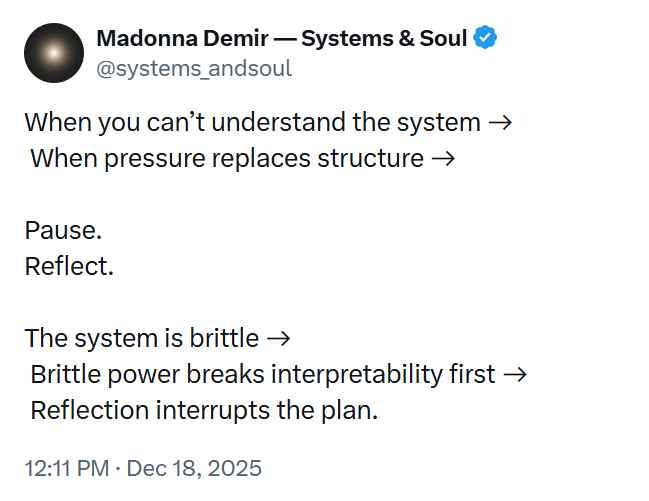
Flow
Rules → loopholes
Loopholes → workarounds
Workarounds → shadow supply chains
Shadow supply chains → lost traceability
Lost traceability → system fragility
Compression
Systems fail the moment the map disappears.
Provenance
Originally posted on X¹ and X2

Related SIA:
When the Factories Left
Date
December 9, 2025
Flow
Factories leave →
the anchor collapses →
the vacuum demands a replacement →
systems choose what people never would →
prisons bloom where production once stood
Provenance
Originally posted on X
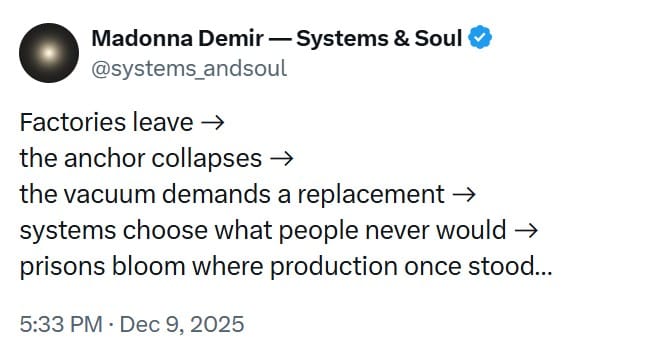
Related essay:
When the Factories Left
UBI Hidden in Plain Sight
Date
December 5, 2025
Prompt / Frame
Will UBI solve issues created by AI taking jobs?
(a theoretical walk)
Flow
AI takes jobs → governments give UBI checks
People stay home → get involved in politics
Time on their hands → pressure builds → demands for change
Institutions can’t tolerate that much free time → UBI gets canceled
Counter-Flow
Employment-based subsidies → make-work
Make-work → jobs
Jobs → income
Income → societal stability
Compression
UBI hidden in plain sight.
Hidden UBI Doctrine.
Provenance
Originally posted on X
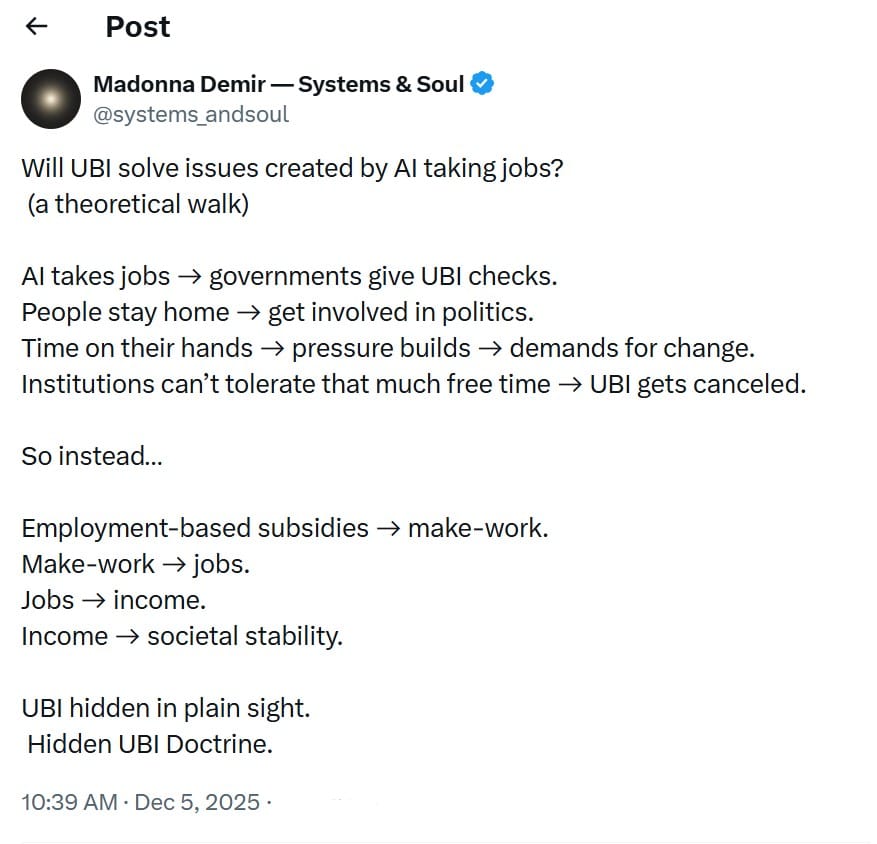
Also posted later in reply to another post on X:
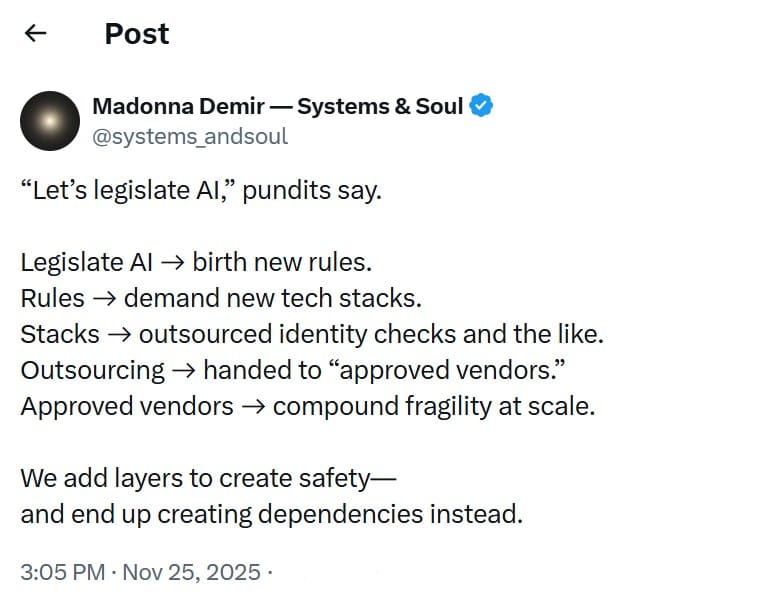
AI Legislation Debate
Date
November 25, 2025
Prompt / Frame
“Let’s legislate AI,” pundits say.
Flow
Legislate AI → birth new rules
Rules → demand new tech stacks
Stacks → outsourced identity checks and the like
Outsourcing → handed to “approved vendors”
Approved vendors → compound fragility at scale
Compression
We add layers to create safety —
and end up creating dependencies instead.
Provenance
Originally posted on X
— Madonna Demir, founder of Convivial Systems Theory and author of Systems & Soul